Waterworks | Gaged Fox EarthCache
-
Difficulty:
-

-
Terrain:
-

Size:  (other)
Please note Use of geocaching.com services is subject to the terms and conditions
in our disclaimer.
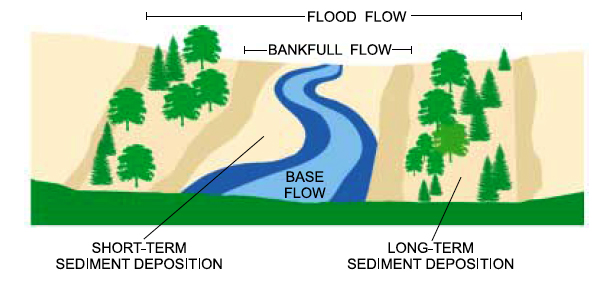
The shape and dimension of a stream channel, in this case the Fox River, is influenced by the frequency, magnitude, and velocity of flows passing through the channel, the type and amount of sediment coming into to the channel from runoff and erosion, and the structural characteristics of the channel stream bed and banks. In this urban environment large volume storm water inputs, like the ones we've seen this spring and summer, can have major impacts on the river's geomorphology and aquatic life. It is essential that these aspects of storm water influence are monitored to prevent and or arrest bank erosion which can not olny result in structural damage and aesthetic degradation of the landscape, but have major impacts on stream bed aquaculture and the species that feed off it.
In unprotected urbanized watersheds, increased stream bank erosion can exceed sediment accumulation and bank rebuilding, resulting in the enlargement of the channel. So it becomes very important to monitor stream flow and stream bed sedimentation to see how well sedimentation deposits are keeping up with erosion. But, this doesn't mean that increased sedimentation to compensate for bank erosion is always a good thing. During periods of high flow, suspended stream small particle sedimentation greatly increases. This is due to a number of factors including urban runoff from paved surfaces and construction site runoff where exposed and unprotected soils erode rapidly during major storm events. The result is an increase in suspended sediments and an increase in turbidity (cloudiness). The greater the turbidity, the harder it is for sunlight to penetrate and filter through to important submerged aquatic vegetation which is vital for a healthy ecosystem.
One of the ways the USGS keeps track of urban storm water effects is by monitoring stream flow with a gaging station.
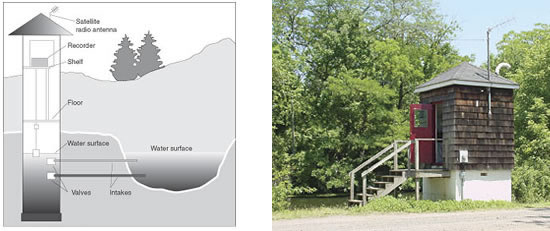
Gaging stations automatically monitor streams as well as wells, lakes, canals, reservoirs and or other water bodies and feed the data into the USGS database in real-time. Instruments at these stations collect information such as water height, discharge, water chemistry and water temperature. The gaging station you will visit supports a side-looking doppler current meter (which was installed to replace the original Acoustical Velocity Meter (AVM) system) which resides underwater in the channel.
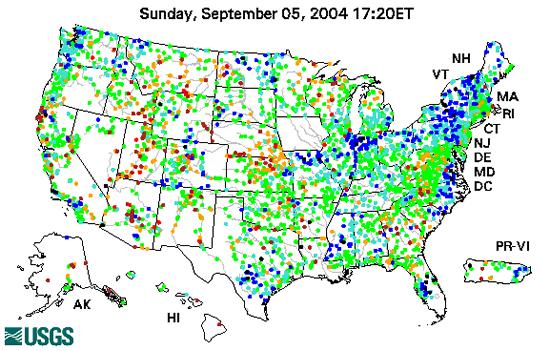
The US Geological Survey has gaging stations at thousands of locations across the United States. Each dot on the map represents one USGS stream gaging station in the real-time stream flow data system. At any given moment, you can look up current stream flow information at any of these real-time stations. Click on the map and you'll go to the stations located in Wisconsin. Select any of those sites and you will be taken to the site-specific information database. In this case, you want to locate the Fox River Gaging Station so you can analyze the real-time stream flow data.
Measurements from these stations are not only useful for monitoring stream-bed erosion but are also useful for flood prediction, water management, recreation and navigation purposes. Your task will be to answer some questions about the monitoring station at the posted coordinates and then to look up the real time storm water readings of the gage station and report your findings for the day you log the cache find. I may verify your answers for the specific day you log your find.
Here are your questions:
1. This Gage Station became operational in what year?
2. What is the average discharge at this station as stated on the plague?
3. Also on the plague, the station was dedicated to an individual, how old was that individual when he passed away?
Now, to the Day-specific questions:
A. What is the peak discharge in cubic feet per second to the nearest thousandths?
B. What it the highest temperature for the day to the nearest half-degree?
C. What is the peak stream velocity to the nearest half-foot per second?
Now that you are familiar with the USGS storm water monitoring system, take some time to look at the station nearest your hometown and see how your number compare. Feel free to post your answers for A-C in your "found it" log, but please only supply the answers for 1-3 only via e-mail. Logs with answers to numbered questions will be deleted.
Sources: USGS National Water Information System 2008.
Water-Resources Investigations Report 03-4123, "A Summary Report of Sediment Processes in Chesapeake Bay and Watershed" edited by Michael Langland and Thomas Cronin, 2003.
Update: 10.24.15 Reduced number of questions given revised information available from USGS.
Additional Hints
(No hints available.)