Grazalema, el poder del agua
(English below)
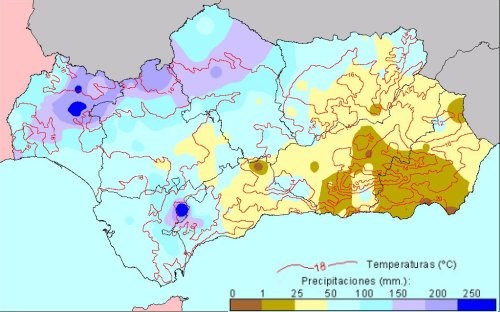
La Serranía de Grazalema es el área de mayor índice de lluvias de la Península Ibérica. Éstas, provenientes del Atlántico se sitúan en las Sierras cercanas a la gran muralla de la Sierra del Pinar y la depresión del Boyar. Teniendo en cuenta la situación geográfica de la provincia de Cádiz, podríamos extrañarnos en un principio del alto nivel de pluviosidad existente.
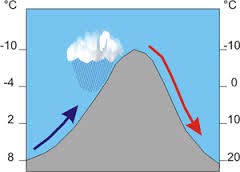
Si lo estudiásemos con más detenimiento, comprobaríamos que la Sierra del Pinar constituye la primera barrera importante con la que se encuentran los frentes borrascosos procedentes del Golfo de Cádiz que, en sólo 80 kilómetros que separan la sierra de la costa, topan con este muro natural, que al tener que elevarse y rápidamente enfriarse provocan la condensación del vapor de agua y como consecuencia de ello sobrevienen las lógicas precipitaciones.
Grazalema recoge las mayores precipitaciones medias de la mitad sur de la peninsula. Sin embargo estas lluvias no se distribuyen de forma homogénea a lo largo del año sino que son estacionales.
El estadío más lluvioso es el invierno, al que le sigue un verano seco con registros entre los meses de julio y agosto de 5/6 litros por m2. Las máximas cantidades se recogen entre diciembre y enero con mas de 400 litros por m2. Las cantidades caidas han fluctuado durante los últimos 80 años entre los 4.372 litros por m2 de 1963 y los 1.179 de 1.974.
Con carácter anecdótico apuntaremos varios días en que se recogieron en el pluviómetro de Grazalema jornadas de lluvias en cifras durante las 24 horas. Por ejemplo y como dato estadístico en 1963 se recogieron más de 4.300 litros en 111 días. En el mes de enero de 1948, 348 litros. El 21 de noviembre de 1916, 213 mms en un solo día. El 21 de diciembre de 1981, 222 mms. El 10 de febrero de 1985, 337 mms.
Para loguear el earthcache
Debes enviar las respuestas a las siguientes preguntas a mi dirección de correo ngbgps@gmail.com . En las coordenadas iniciales de este earthcache encontrarás una placa sobre las precipitaciones en Grazalema y las utilidades del agua. Con la lectura de esta placa podrás contestar a las siguientes preguntas:
1.- ¿Cuantos litros por metro cuadrado de lluvia se recogen de media en Grazalema? ¿Por que crees que la cifra es tan elevada?
2.- ¿Cual es el nombre del antiguo molino que se menciona en la placa?
3.- Año del que data la placa según la firma.
4.- Opcionalmente incluye una foto tuya desde el mirador a la sierra que se encuentra frente a la placa en las coordenadas del waypoint. También sería genial si nos dices de que parte del mundo vienes.
No es necesario que esperes a mi respuesta. Puedes loguear nada mas escribir tu correo. Si hay algún problema contactaré contigo. Me reservo el derecho a borrar logs que muestren imágenes de la placa o que sean incorrectos.
Grazalema, the power of water
(Español arriba)
Sierra de Grazalema is the area of greatest rainfall index of the Iberian Peninsula. These rains coming from the Atlantic are located in the Sierras near the great wall of mountains of Sierra del Pinar a Boyar's depression. Given the geographical location of the province of Cádiz, we might wonder at first why the high level of rainfall of Sierra de Grazalema.
If we studied more closely, we would find that Sierra del Pinar is the first major barrier that the storms find. There are only 80 kilometers from the Gulf of Cadiz to the mountains. The storms encounter this natural wall having to rapidly rise. Fast cooling causes the condensation of the steam and consequently precipitation.
Grazalema collects the highest average precipitation in the southern half of the peninsula. However, these rains are not distributed evenly throughout the year but are seasonal.
The rainy season is winter, which is followed by a dry summer with records between July and August 5-6 liters per m2. The maximum amounts are collected in December and January with more than 400 liters per m2. The Fallen figures have fluctuated over the last 80 years between 4372 liters per m2 in 1963 and 1,179 in 1974.
Some anecdotes. For example, in 1963 over 4300 liters in 111 days were collected. In January 1948, 348 liters. The November 21, 1916, 213 mms in one day. The December 21, 1981, 222 mms. The February 10, 1985, 337 mms.
To log the earthcache
Send the answer of the next questions to my email account ngbgps@gmail.com . At the given coordinates in the earthcache you will find a plaque about rainfalls in Grazalema and uses of water. Reading this plaque you will be able to answer next questions:
1.- How many liters of rain water per square meter are collected on average in Grazalema? Why do you think the figure is so high?
2.- What is the name of the old mil (molino in spanish) that is mentioned on the plate? (Name of the mill is between quotes)
3.- Year of the plaque as it is written in sign
4.- Optionally attach a picture of you in the viewpoint to the mountains that is in front of the plate. Coordinates of the viewpoint are given in a waypoint. It would be great if you also tell us what part of the world are you coming from.
You don't have to wait for my reply. Log it as soon as you write me the email with the answers. If I find a problem I will contact you. I reserve the right to delete logs that show images of the plate or with incorrect aswer.