EDUCATIONAL LOGGING REQUIREMENTS
In order to substantiate your visit and comply with the educational requirement for Earth Caches you have to submit your answers to the following questions to the cache developers via their profile:
For purposes of logging this cache you must answer the following four questions.
1) Why must the water be flowing faster to erode fine clay that the speed to erode fine sand?
2) At what velocity will a cobble of 100mm be deposited?
3) Choose a rock and estimate its size. between which velocities will this rock be transported down the river? Please indicate the rock size.
4) There is a large block in the pool on the right. What is this? (Locational question)
|
At the published coordinates you will be standing on a bridge over the river. There is a pool that contains eroded sediments and rock that has been transported down the river. The questions above will have to be answered with reference to what you see and the information in the description below.
Water plays a significant part in the weathering and erosion of the earth's surface. This Earth Cache is looking at one aspect of the transport of eroded rock by water streams and rivers. Flowing water picks up sediments, transports it as it flows and deposits it when the flow slows down. How fast must water flow to pick up the sediment and when will the sediment be deposited as the water slows?
The Hjulström curve, named after Filip Hjulström (1902–1982), is a graph used by hydrologists and geologists to determine whether a river will erode, transport, or deposit sediment. It was originally published in 1935. The graph takes sediment particle size and water velocity into account.
The upper curve shows the critical erosion velocity in cm/s as a function of particle size in mm, while the lower curve shows the deposition velocity as a function of particle size. Note that the axes are logarithmic.
The plot shows several key concepts about the relationships between erosion, transportation, and deposition. For particle sizes where friction is the dominating force preventing erosion, the curves follow each other closely and the required velocity increases with particle size. However, for cohesive sediment, mostly clay but also silt, the erosion velocity increases with decreasing grainsize, as the cohesive forces are relatively more important when the particles get smaller. The critical velocity for deposition, on the other hand, depends on the settling velocity, and that decreases with decreasing grainsize. The Hjulström curve shows that sand particles of a size around 0.1 mm require the lowest stream velocity to erode.
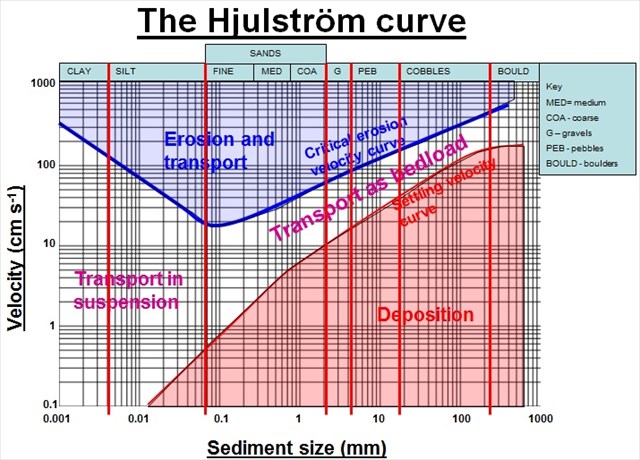
The curve is not perfect as there are other factors that come into play such as the depth of the water and characteristics of the sediment. The curve has been expanded on by other geologists to take these factors into account.
Does this sound too complicated? How about it in plain English? The graph shows the relationship between the size of sediment and the velocity (speed) required to lift it, carry it along and deposit it. The velocities for transport are lower than that for erosion, because it takes much more energy to lift sediment than to maintain it in transport (think about carrying a heavy bag, it takes more energy to initially lift it than to carry it). The other unusual pattern is that it takes more energy to erode some of the smallest particles. This is because they are clay particles which stick together, so they need a lot of energy to be eroded.
Some examples:
- At 20 cm per second fine sand is eroded while pebbles would be deposited.
- The smallest clay particles require velocities of 200cm per second to be eroded. For the smallest silts it is approximately 120cm per second.
- Cobbles are eroded upwards of 170cm per second.
- Deposition starts to occur at 0.1 cm per second for particles of approximately 0.01mm in size.
- Boulders require the smallest velocity for deposition, at only 150cm per second for the smallest boulders 250mm in size.
- Course sand of 0.5 mm in size is transported between 3cm per second and 16 cm per second.
References
Wikipedia
Coolgeography.co.uk