
 This earthcache is on the Crystal Cove State Beach. A
parking fee is required. Pictures are key to this cache. There
should be a rock to stand on at the coordinates. Face
northwest toward the point (see my picture when it gets
posted). We will build up an album of pictures showing the
seasonal changes to the beach profile over time. Be sure to
include the season, and if it was high or low tide
(approximate time of day you took your picture will do) as
well as the size of the waves and in your post. These will be
useful when looking at the pictures over time.
This earthcache is on the Crystal Cove State Beach. A
parking fee is required. Pictures are key to this cache. There
should be a rock to stand on at the coordinates. Face
northwest toward the point (see my picture when it gets
posted). We will build up an album of pictures showing the
seasonal changes to the beach profile over time. Be sure to
include the season, and if it was high or low tide
(approximate time of day you took your picture will do) as
well as the size of the waves and in your post. These will be
useful when looking at the pictures over time.
Sand on the beach is constantly being moved around. As you can
see, each wave that comes in pushes around the sand on the beach,
turning the ocean water at the shore brown. The difference in
energy between summer and winter waves drastically changes the look
of the beach.
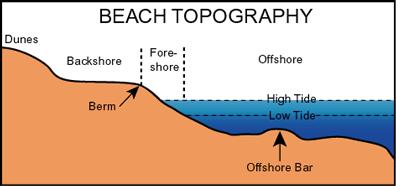 To examine this seasonal change, it is good
to have names for the different parts of the beach. In this
case, we’ll look at three parts, the backshore, the foreshore,
and offshore.
To examine this seasonal change, it is good
to have names for the different parts of the beach. In this
case, we’ll look at three parts, the backshore, the foreshore,
and offshore.
The backshore begins at the vegetated cliffs to the high tide
level and is comprised of the berm and berm crest. The berm is the
relatively flat sandy area where everyone loves to put their beach
towels. At the berm crest, beach slopes more steeply to the high
tide level. The width of the berm changes seasonally. During the
summer it is wider than during the winter. This change in width
results in the moving shoreward or seaward of the next two
zones.
The foreshore begins at the high tide line and stretches to the
low tide line. This section of beach in usually slopes downward at
a uniform level. Because of the tides, this section of beach is
periodically below sea level or above sea level.
 Beyond the foreshore is the offshore
beginning begins at the low tide line and extending off shore.
This section of the beach is always below sea level but
constantly affected by the waves. The offshore profile changes
seasonally. During the summer, it is a relatively uniform
slope down. During the winter, a trough (low point) forms with
mounds of sand (bars) eroded from the berm shoreward and
seaward of the trough.
Beyond the foreshore is the offshore
beginning begins at the low tide line and extending off shore.
This section of the beach is always below sea level but
constantly affected by the waves. The offshore profile changes
seasonally. During the summer, it is a relatively uniform
slope down. During the winter, a trough (low point) forms with
mounds of sand (bars) eroded from the berm shoreward and
seaward of the trough.
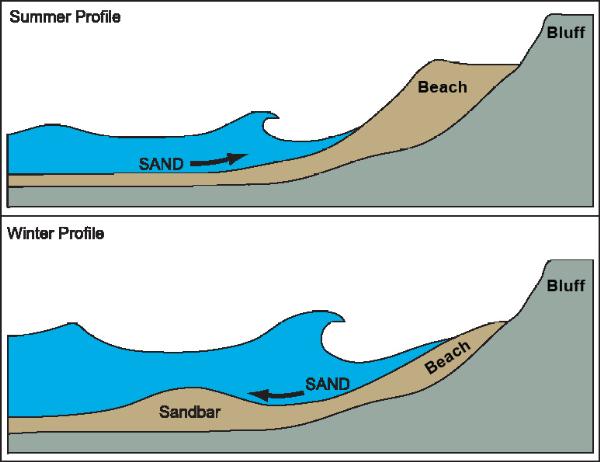
The seasonal changes noted above are caused by the different
energy levels of summer and winter waves. Winter storms generate
shallow waves with more energy than summer waves. The winter waves
erode sand off the beach and store it in offshore bars.
The winter waves are generated by local storms. They form large
waves that do not extend deep beneath the ocean surface. Thus as
they crash on the shore they have enough energy to pick up sand and
pull it off of the foreshore into deeper water where the shallow
waves do not reach. The largest storm generated waves also erode
the face of the berm crest, reducing the width of the berm. The
sand is then deposited in sandbars off-shore.
During summer, the waves are generated by storms far out to sea.
These waves are milder but because they have been traveling across
the ocean, they have developed into deeper waves. As these waves
come to shore they pick up the sand that was deposited int he
off-shore sand bars and transport it back onto the foreshore. As
the water flows back to the ocean, there is not enough energy to
transport as much sand as the wave brought onto the forshore back
off shore, resulting in a net gain of sand. This results in the
gradual build up of the berm crest and the berm widens for the
summer.
This discussion has dealt only with the seasonal on and
off-shore transport of sand. There are many other processes
occurring with sand transport at the coast including longshore
transport, river replenishment, etc. These processes are examined
in other earthcaches.

October, 2004
source: http://www.californiacoastline.org/
Logging requirements:
Send me a note with :
- The text "GCPFR9 Seasonal Beach Sand Cycles - Crystal Cove" on
the first line
- The number of people in your group.
- Post a picture with your back facing the cliffs looking out to
sea. You should see at least the tops of the rocks in the
sand.
- Be sure to include the season, and if it was high or low tide
(approximate time of day you took your picture will do). If you
don't have a camera, describe in your log how much sand appears to
be covering the rocks between the coordinates and the ocean.
- Compare the amount of sand around the rocks (that is determined
by the approximate height of the rocks showing above the sand) to
the size (estimate the height of the wave) and frequency (estimate
how many waves per minute) of the waves.
The following sources were used to generate this
cache.
-
http://coastalchange.ucsd.edu/st3_basics/beaches.html
- KIKI PATSCH and GARY GRIGGS, OCTOBER 2006,
LITTORAL CELLS, SAND BUDGETS, AND BEACHES: UNDERSTANDING CALIFORNIA
S SHORELINE; INSTITUTE OF MARINE SCIENCES UNIVERSITY OF CALIFORNIA,
SANTA CRUZ CALIFORNIA DEPARTMENT OF BOATING AND WATERWAYS
CALIFORNIA COASTAL SEDIMENT MANAGEMENT WORKGROUP
-
http://www.ocean.uni-bremen.de/EInfo/materialien/elemOc/top12-17/topic14.html
- Office of Naval Research; Habitats: Beaches -
Characteristics;
http://www.onr.navy.mil/focus/ocean/habitats/beaches1.htm
Save on State Park entry fees by bagging other
Earthcaches in Orange County State Parks on the same day:
GCP7ZT, GCP3GQ, GCQ4ZR , and GCPZYK