To log this cache, you have to visit a place where you
will appreciate the large tidal ranges seen in this part of the
world. DO NOT VISIT THE CACHE SITE WITHOUT HAVING CHECKED THE
TIDE TABLES –
Link.. YOU MUST VISIT THE CACHE COORDINATES TO LOG THE
CACHE. You will have to visit the actual cache site
once at low tide, but return close by later at high tide. Not a
cache and dash, I'm afraid! Suggested parking is at N54
07.030 W3 14.657. Suggested point for taking photos and
overlooking this spot from dry land at high tide is at N54 07.156
W3 14.688.
The terrain for this cache is uneven underfoot, but firm.
It should be fine for children, with care (the mussels can be
sharp), not soo good for anything wheeled. Wellies work but
aren't necessary - as long as you time it right! Wading not
essentily, but possible! The cache location is on a public
footpath that crosses the bay from the mainland to Walney. An
interesting link for some history of this site is at http://www.walney-island.com/walney_channel_01.htm
?
The Walney Channel sees some extreme tidal ranges, with
over 10m being measured at Roa Island just up the channel.
Such ranges make the sands exposed at low tide very dangerous if
the walker is unaware of the current tide table. The purpose
of this cache is to teach the cacher a bit about tides.
The gravitational pull of the moon, and to a lesser
extent the sun, combine with the centrifugal force of the earth to
influence the movement of oceanic water and create tides. The moon
pulls water in the world’s oceans towards it – and the
centrifugal force of the earth spinning causes the water to form an
ellipsoid shape - with the water being pulled away from the
earth’s sides. This is shown in the diagram
below. The moon has the biggest influence, so as it goes
around the earth, it causes the water in the oceans to be pulled in
different directions – hence causing the low and high tides,
the timing of which is based on the rotation of the moon around the
earth. When the ocean is pulled to its highest extent, it is
high tide – and the lowest extent is low tide.

The sun’s gravity also affects the pull on the
oceans, but to a lesser extent. So, when the sun and moon are
aligned, it pulls the tide even more – the tide ranges are
greater, and these tides are known as “spring” tides.
. When they are at 90 degrees, the tides are pulled less and
are known as “neap” tides. The moon is in line with the
sun at full and new moons – so this is when the largest tidal
ranges are found.

The period of the moon’s rotation sets the full
tidal period of high-low-high tide as approximately 12.5
hours. The period of the moon’s position relative to
the sun sets the period of spring-neap-spring tide to be 28 days
– a lunar month. There is a useful animation of this at
this link.
The moon’s rotation and relative position to the
sun is highly predictable, so tide tables can be created predicting
the tides. The tides at the location of the cache are best
estimated by looking at the tide tables for Barrow –
Ramsden Dock. Below is an example of what the tide table
looked like when researching this cache:

An example of the actual tide times from the table is
below:

LW stands for “Low Water” and HW stands for
“High Water”. The times on this website are in
GMT, so if it is British Summer Time, remember to adjust for
“Daylight Savings” by adding an hour.
The first number below the LW or HW is the time of day
when the low or high tide will occur. The second number is
the height of the tide above the datum. The difference
between the height of the tide at LW and HW is known as the tidal
range In the example, the tidal range is (7.4 – 2.9) =
4.5m – which is a comparatively low tidal range for this
areas, because this was a neap tide. In the picture, you can
see how much larger the tidal range was at the end of the week
– just 5 days later. Spring tides mean much higher
tides. Also, a much larger volume of water has to move, so
the water moves faster – important if you are on the water
moving against it, or on the beach running away from it!
While the tide times are predictable, great care is still
needed. Sinking sands can be found at low tide (none in
evidence here). Strong winds can affect tides. If in
doubt, seek local advice.
The log this cache, you have to complete the
following:
- Visit the coordinates of this cache at low tide
(within an hour either side). If you have any doubt, visit one hour
before low tide. When standing on the bridge, estimate the
distance between the sole of your foot and the surface of the water
running underneath the bridge.
- Using tide tables, work out how much the water will
rise between now and high tide (the tidal range)
- Work out under how much water the sole of your foot
will be at high tide. (Tidal Range minus distance from foot to
water)
- See which way the water is flowing (just for
fun).
- Don’t hang around here for high tide!
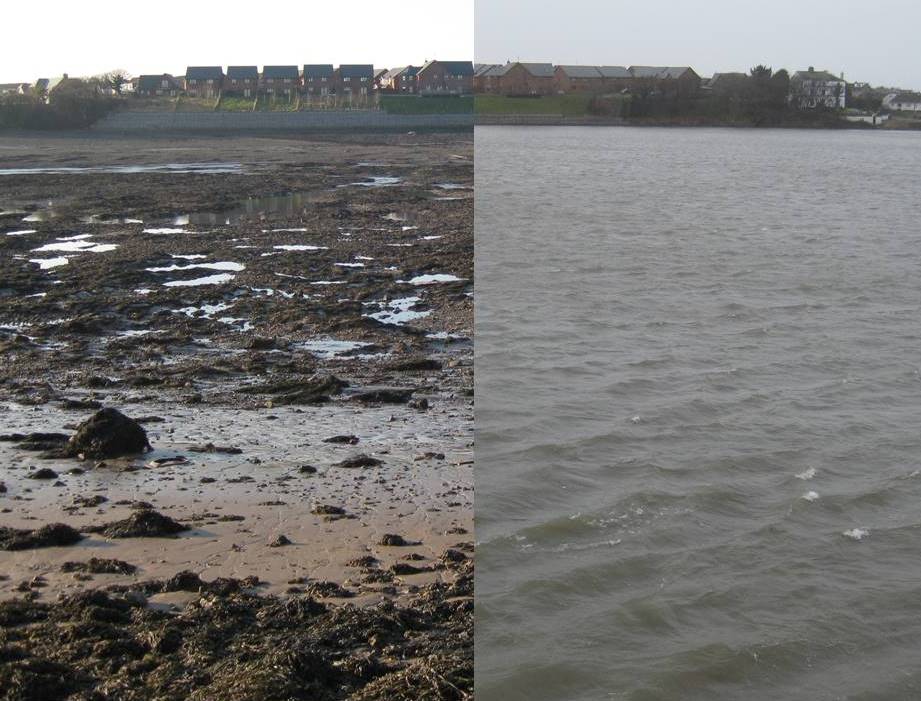
- To truly appreciate the tides, you need to look at
this spot at high and low tide. I would suggest within 1 hour
of high tide and 1 hour of low tide. Describe the difference,
and indicate which way the water is flowing at each
time.
- Record the time and day of the measurements and
observations in your log, along with the measurements. Upload
2 photos from the same spot if you can – of high tide and low
tide. As each record will be unique, you can post these
answers in your log. See example log
below. There is a waypoint for the location where this
picture is taken.
- If you can take a photo of the location at a different
time, please do so and upload it.
- Please label any uploaded photo with the time
referenced to a high or low tide. Check the examples.
This will make the gallery of pictures more interesting.
Sources:
Tide Tables at http://easytide.ukho.gov.uk/EasyTide/
Local tidal information at http://www.barrowbc.gov.uk/default.aspx?page=1230
Diagrams from
http://upload.wikimedia.org/wikipedia/commons/d/d8/Field_tidal.png
and http://www.derekscope.co.uk/2010/07/3286/