SHERWOOD ISLAND STATE PARK
Sherwood Island State Park1
is extremely popular in the summer. This is one of the few
shoreline recreational areas open to the public in the densely
populated southwestern part of Connecticut and hence is usually
crowded during summer weekends. This EarthCache may be done
in the off-season just as easily as during the summer: we
would recommend a bright October day! An entrance fee is
charged during the summer.
Purpose: This EarthCache is
published by the Connecticut Geological and Natural History Survey
of the Department of Environmental Protection. It is one in a
series of EarthCache sites designed to promote an understanding of
the geological and biological wealth of the State of
Connecticut.
Supplies: You will need a copy of
this login to answer the questions once on site and be able to take
a few photos on site. Spoilers may be included in the
descriptions or links.
Location:
N. 41o 06.6916’,
-073o
19.8084’
Directions: In Westport, exit 18
off I-95 is the Sherwood Island Connector and will take you
directly to the Park.

Figure 1. Quaternary geologic map of
Sherwood Island State Park (from Stone and others, 2005) superposed
upon a topographic based map (SherQuat.jpg). The area
colored moderate grey has been filled-in, turning the salt marsh
into parking areas. A low stream-lined hill makes up the
higher area (maximum elevation is just over 40 feet above sea
level) of the park. The pale green and greenish grey colored
areas are covered by glacial till. Note that the streamlined
hill is covered with till; it is a drumlin (line with black circle
is map-symbol for drumlins). The cream colored area is sand
and gravel and the yellow areas are salt marsh. Beach sand
and gravel is colored pale tan. Line of black triangles marks
location of an esker.
Activity 1. Glacial till forms
the soil on top of the low hill west of the East Beach (Alvord
Beach) parking area, but north of the Pavilion parking area (north
of GPS location above). The hill is smooth and rather
streamlined (Figure 2 A, B). It was shaped into a mound
beneath the last Ice-Age glacier as the glacier slowly moved
southeastward. The feature is called a drumlin. It is
composed of thicker than usual till. Glacial till is a
glacial deposit (soil) composed of mud, sand, and gravel and
usually contains cobbles and boulders of rock eroded from nearby
outcrops (to the north).
A. 
B. 
C
D
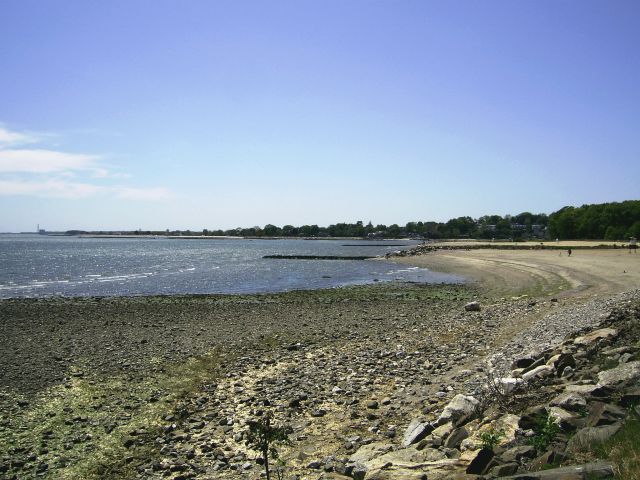
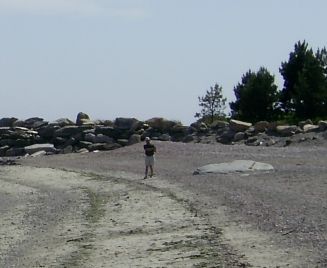
Figure 2. A. Drumlin at Sherwood
Island shown in profile, looking toward the east. Note smooth
shape of drumlin. Picture was taken from behind West
Beach. Note salt-marsh at left of picture. The
sides of drumlin have been partially buried by marsh and beach
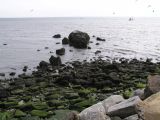
deposits. B. Cross-sectional profile of western
half of drumlin, looking north. C. Rocks off Sherwood Point,
opposite the pavilion. These are rocks that originally were
part of till that composed the drumlin. Waves have eroded the
finer material that composed the till, leaving behind the rocks too
large to move. The cobbles form a pavement that protects the
point from further erosion. D. Pavement of
glacial cobbles line the shore to the west of Sherwood Point.
The cobble pavement indicates that the drumlin once extended
farther seaward.
Drumlins you may have seen at other locations
were probably more imposing (higher hills) than this one at
Sherwood Island. This one has 40 feet of relief, but probably
was much higher before a beach and salt-marsh filled around it,
burying it’s sides.
The southern end of this drumlin extended
farther southeast (into the Sound) at least several hundred feet,
beyond where the shore is today. But after the glacial ice
melted, waves generated in Long Island Sound began eroding the
sound-end of the drumlin. Waves can easily erode the finer
components of till (sand, gravel and mud) but they are not strong
enough to erode the cobbles and boulders. Thus the cobbles
get left behind forming what is called a lag-deposit.
Lag-deposits form an armor that retards further wave erosion of the
headland (Figure2 C, D).
Activity 2. Find N. 41o
06.6786’, -073o 20.2674’. Sand is
constantly moving in the beach environment. You can see this
in the surf-zone where sand is moved by each wave that

A
B


C
D.
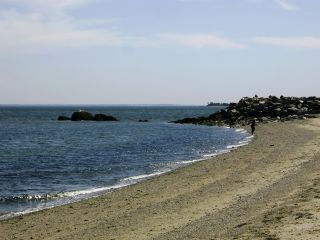
Figure 3. A. East Beach
(identified as Alvord Beach in Fig. 1), looking at Sherwood
Point. Notice waves breaking on shore at an angle to
the shore. Sand grains swash diagonally up the beach face and
then backwash straight down the beach. Hence at the end of
the backwash and individual sand grain has moved down the beach in
the direction toward which the waves break. B. Ripples
exposed on emergent sand bar off West Beach. The ripples were
created on the sand when it was submerged by waves on the surface
of the water. These ripples have little breaks in them caused
by waves traveling from two different directions interfering with
each other. C, D. Pictures (looking
north) taken on opposite sides of the same jetty illustrating sand
build-up on the east (right) side and sand starvation on the west
caused by longshore drift.
washes up on the shore. Larger waves, of
course, move larger and greater quantities of sand grains.
Sand on the shallow sea floor is also moved by the waves.
Waves affect the bottom up to a depth equal to half the spacing
between individual waves. In Figure 3A the distance between
successive waves is about 4 feet (estimate on my part); those waves
can affect the bottom up to a depth of 2 feet. Larger waves
are wider apart and thus affect deeper parts of the sea
bottom. The process of transporting sand both above and below
water by the waves in this fashion is called longshore
drift.
Longshore drift on most beaches in Connecticut
is toward the west. Normally, sand that is moved westward at one
end of the beach is replaced by sand coming from the other end of
the beach. Thus the beach remains stable.
Westward drift can be demonstrated at Sherwood
Island State Park by examining the jetties that extend seaward at
West Beach. The jetties are an impediment to longshore drift:
they catch the sand on the up-drift side. The down-drift side
then loses its supply of sand nourishment. The waves,
however, continue to move whatever sand is left. The beach,
thus, erodes on the down-drift side of the jetty (see Figure 3
C,D).
Although the wind blows more often out of the
southwest, southwesterly winds usually blow at more gentle speeds,
generating low waves (Figure 3A). The resulting sand movement
is not very significant. Because sand is caught up on the
east side of the jetties suggests that significant sand movement
occurs when the waves come out of the east and southeast.
East and southeasterly winds are most often associated with storms
in New England and storms generate larger waves.
Find N, 41o 06.633’,
-073o 19.7736’. According to Park
maintenance-personnel, significant sand deposition occurred on the
beaches during a recent late summer storm (September 2-3,
2006). The wind blew out of the east at a steady 30 knots (35
mph) for half the day and night2. Such winds would drive
longshore drift toward Sherwood Point. Large piles of sand
were deposited onto the grassy area adjacent to East Beach (Figure
4A). A large stone had about 3 feet of sand deposited at its
base which partially buried the stone (Figure 4B). Sand
remained fairly stable through the 2007 seasons, but in the summer
of 2008, prolonged southwesterly winds have driven sand back
eastward, removing sand from in front of the stone (Figure 4C).
2.
http://www.wunderground.com/history/airport/KBDR/2006/9/2/DailyHistory.html?req_city=NA&req_state=NA&req_statename=NA.

A.
B.
C.
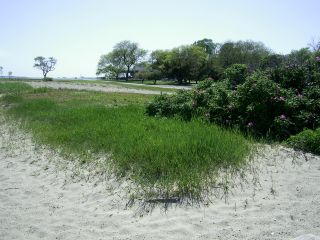
Figure 4. A. Sand pile deposited at edge of
grass during the Labor Day 2006 storm. B. Stone at
right of picture was partially buried by about 3 feet of sand
during same storm before partial burial stone was about “shoulder
high”. Picture taken on in late May, 2008, just east of
observation point, which may be seen in background. Notice
that beach berm is in front of the rock. C. Same stone
in early August, 2008. Notice that sand has been removed from
the front of the stone.
This part of the shoreline is considered by
Patton and Kent (1992) to be moderately (“significant erosion”) or
severely (“massive erosion”) eroded. However, careful work by
marine scientists at Long Island Sound Project of DEP have
identified and documented a chart showing an accurately located
high tide line in the 1880s (Figure 5). This chart was

Figure 5. Aerial photograph taken in
2004 with the 1880’s shoreline superposed in yellow. Pale
yellow overprinted areas were salt marsh in the 1880’s.
Notice much of the beach has expanded since the 1880’s.
geo-referenced and superposed on modern aerial
photographs and show that the East Beach has actually built up some
since the 1880s. Some of the beach accretion may be due to past
beach replenishment projects.
Activity 3. Walk to the east end
of the beach and look northward (N41o 06.9498’,
-073o 19.44’). On the opposite side of the
tidal creek is a linear ridge that is difficult to see (Figure
6) It is composed of sand, gravel, and boulders.
Several nice homes were built upon it. This

Figure 6. Hill on other side of
salt-marsh is the end of a ridge that is about a half mile
long. It is an esker.
feature is called an esker and formed when
sand, gravel and boulders were deposited by melt-water streams that
rapidly and turbulently flowed through a tunnel beneath the glacial
ice or in a crack or crevasse on top of the ice.
How to log this Cache:
1. Take a picture showing you or your
companions at one of the jetties on West Beach that illustrates
sand accumulation on the east side of the jetty and sand starvation
on the west side.
2. Find and measure the height of the
stone shown in Figure 4B, C. How much sand was deposited
since the time when the stone stood “shoulder height” above the
sand. Assume “shoulder height” is 4.5 feet high.
Difficulty: 1
Terrain difficulty: 2
Reference:
Stone, J.R., Schafer, J.P., London, E.H.,
DiGiacomo-Cohen, M.L., Lewis, R.S., and
Thompson,
W.B., 2005, Quaternary Geologic Map of Connecticut and Long Island
Sound Basin (1:125,000). U.S. Geol. Surv. Sci. Invest. Map #
2784.